Stakeholder Scale of Influence
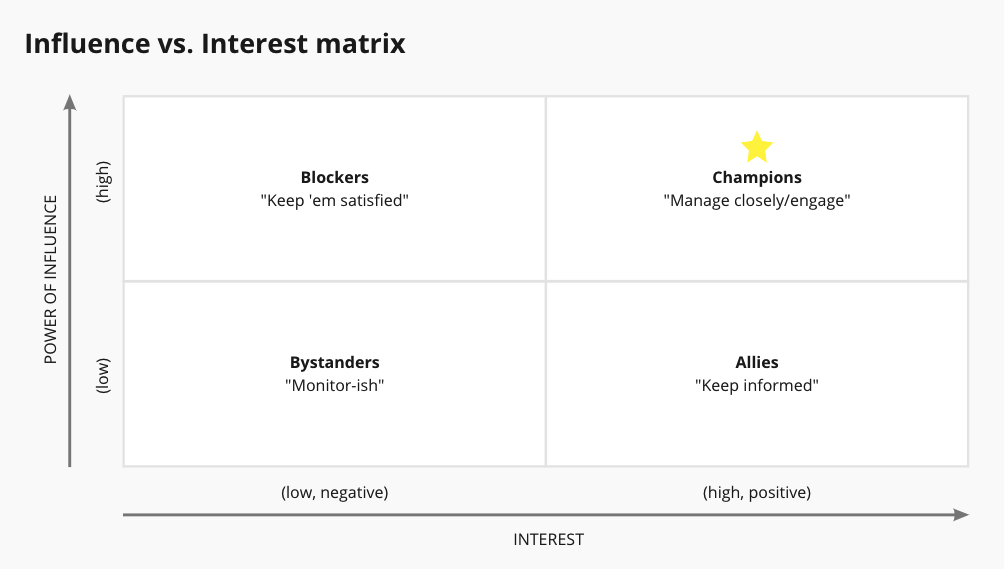
From the information you gathered in your blockers, allies, and decision-makers table, you can now plot your stakeholders visually based on their scale of influence.
Outcome
Stakeholders mapped according to their influence and/or interest so the team knows who they need to monitor vs. closely manage and engage.
Method
- Put each stakeholder on their own sticky
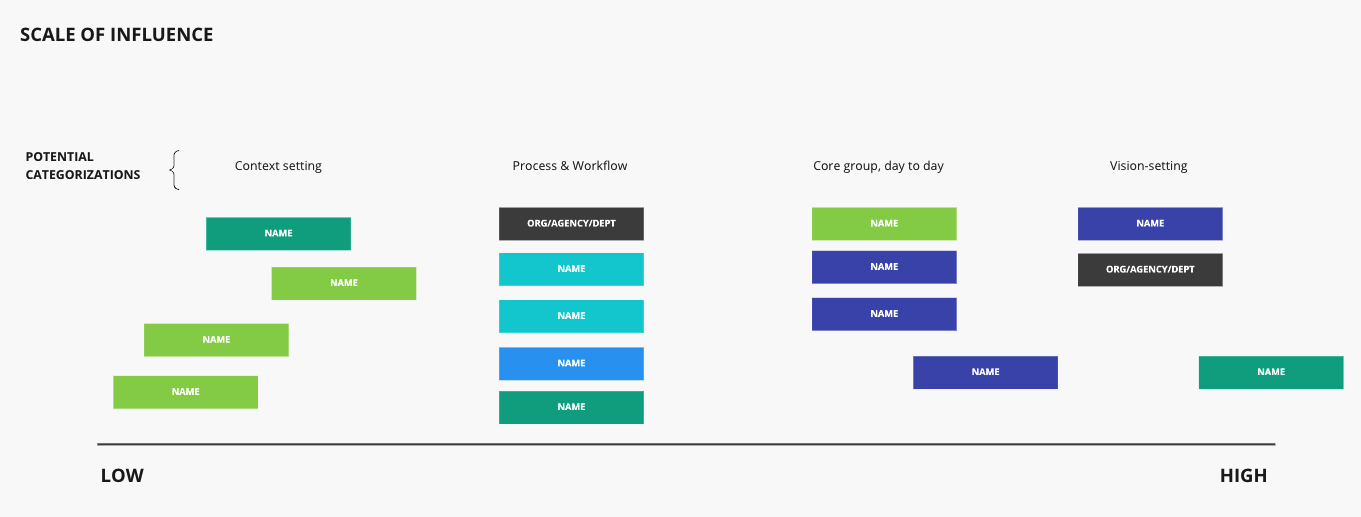
- Using one of the influence maps to the right, plot each stakeholder according to their scale of influence
- Share this out with the entire Truss team. Reference it (or paste it directly into) your project onboarding document.